Eden Schmidt · 14 October 2026
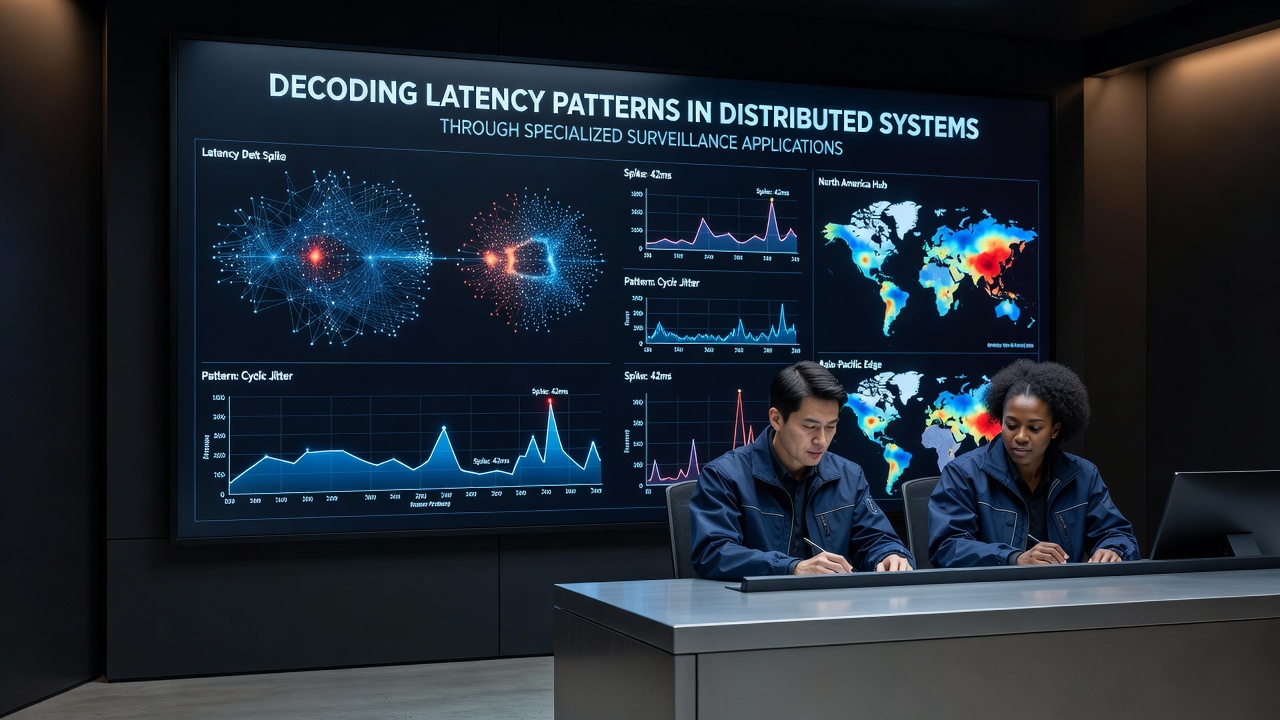
Decoding Latency Patterns in Distributed Systems Through Specialized Surveillance Applications
Distributed systems continue to expand across global infrastructures, and latency remains a core challenge that affects performance, reliability, and user experience in ways that require precise measurement. Specialized surveillance applications have emerged as essential tools for capturing, analyzing, and interpreting these latency behaviors at scale, allowing teams to identify recurring patterns that standard monitoring often overlooks.
Core Mechanisms Behind Latency in Distributed Environments
Latency in distributed systems arises from multiple interconnected factors including network propagation delays, queuing at intermediate nodes, serialization overhead during data transfer, and contention for shared resources across clusters. Researchers have documented how these elements interact in environments that span multiple availability zones, where even minor variations in routing tables can produce measurable spikes that compound over time. Surveillance applications address this complexity by deploying lightweight agents that collect timestamped metrics at each hop, then correlate those readings against baseline models derived from historical traffic flows.
Data from cloud service providers indicates that inter-region latency can fluctuate by 20 to 40 milliseconds under normal load conditions, with larger deviations appearing during peak synchronization events. These applications apply statistical filters to isolate anomalies from expected jitter, enabling operators to distinguish between transient noise and persistent structural issues that demand architectural adjustments.
Surveillance Application Capabilities and Deployment Patterns
Modern surveillance tools integrate with existing orchestration platforms through sidecar containers or kernel-level probes, which minimizes overhead while maximizing visibility into packet-level behavior. They aggregate data streams into time-series databases that support both real-time alerting and retrospective pattern mining. Teams deploy these systems in stages, beginning with edge nodes before expanding coverage to core processing layers, which allows gradual calibration against production workloads.
According to findings presented at the 2026 Cloud Performance Summit held in October, organizations that implemented continuous surveillance across at least three geographic regions reduced mean time to detection for latency-related incidents by approximately 35 percent compared with baseline practices. The applications achieve this through machine learning models trained on labeled datasets that capture both synthetic and live traffic scenarios, refining their predictions as new observations arrive.

Pattern Recognition Techniques Applied to Latency Data
Once raw telemetry reaches the analysis engine, the applications apply several complementary methods to surface meaningful structures. Time-windowed aggregation reveals diurnal cycles and weekly trends, while graph-based correlation identifies which service pairs contribute most to end-to-end delays. Clustering algorithms group similar latency signatures, highlighting recurring motifs that correspond to specific failure modes such as database connection pool exhaustion or misconfigured load balancer weights.
Studies conducted by the National Institute of Standards and Technology have shown that combining these techniques yields higher precision than relying on any single method alone, particularly when systems operate under variable request rates. The resulting insights feed into automated remediation workflows that adjust routing weights or trigger capacity scaling before user-visible degradation occurs.
Integration with Broader Observability Frameworks
Surveillance applications rarely function in isolation; they feed enriched latency datasets into larger observability platforms that also track error rates, throughput, and resource utilization. This integration supports root-cause analysis that traces a latency spike back through the call graph to its originating component. Standards bodies such as the European Telecommunications Standards Institute have published guidelines that encourage consistent metric schemas, which in turn improves interoperability between different surveillance solutions.
Organizations that adopted unified schemas reported fewer false positives during incident reviews, because timestamps and units aligned automatically across services. The applications also export data in formats compatible with academic repositories, enabling external researchers to study long-term trends in production environments without direct access to proprietary infrastructure.
Conclusion
Specialized surveillance applications have become central to understanding latency dynamics within distributed systems, supplying the granular visibility required to move beyond reactive troubleshooting. By combining high-resolution collection with advanced analytical methods, these tools allow teams to decode complex patterns that influence overall system behavior. Continued refinement of both the instrumentation layer and the pattern detection algorithms will determine how effectively organizations maintain performance as distributed architectures grow more intricate in the years ahead.